


菲律宾
1.首都:马尼拉
2.人口:1.7亿人(2015)
3.官方语言:菲律宾语、英语
4.货币:菲律宾比索(PHP)
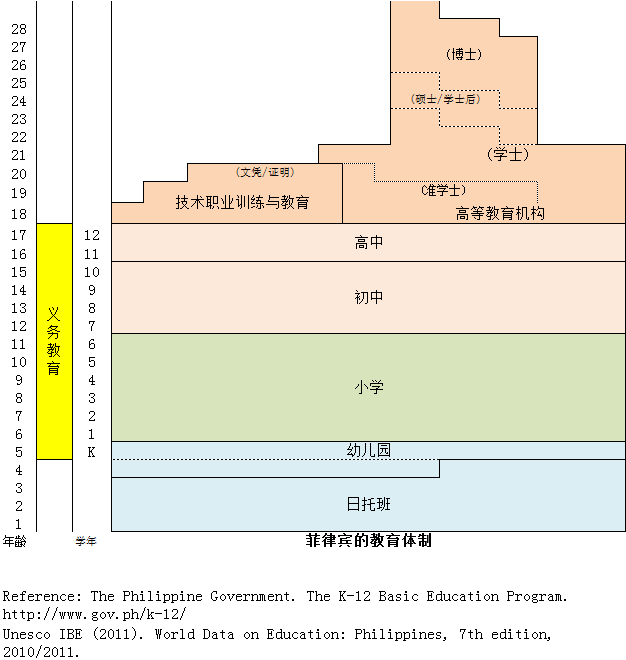
5.教育及保育制度
- 学制:学前教育(5岁)、小学(6-11岁)、初中(12-15岁)、高中(16-17岁)、高等教育(18岁开始)
- 管辖机构:ECCD早期儿童保育与发展协议会(负责0-4岁的婴幼儿保育)、教育部(管辖初等和中等教育)、 高等教育委员会(管辖高等教育)、 技术教育与技能发展署 (管辖技术职业训练和教育)
- 义务教育:5-17岁
- 2011年开始实施K-12基础教育课程,幼儿园(K)入学变为义务化。并新增加了高中教育,使中等教育延长2年,原先为期10年的义务教育变为13年。伴随新制度下的第一届高中毕业生将于2018年诞生,预计将从2018年年开始将缩小大学的一般教育课程。
6.在籍率
- 3岁:暂无数据
- 4岁:暂无数据
- 5岁:暂无数据
- 6岁:暂无数据
7.公共财政教育支出占GDP比例
- 就学前:暂无数据
- 初等、中等、高等教育以外的中等之后的教育:暂无数据
- 整个教育阶段:暂无数据
8.班级规模
- 初等教育:暂无数据
9.1名教师員所对应的学生人数
- 就学前:暂无数据
- 初等教育:暂无数据
10.国际学习能力调查中的排名
- PISA 2012: 没有参加
- TIMSS 2011(4年级): 没有参加


相关内容出处
2. Population Division, United Nations. World Population Prospects: The 2012 Revision. http://esa.un.org/unpd/wpp/unpp/panel_population.htm.
5. The Philippine Government. The K-12 Basic Education Program. http://www.gov.ph/k-12/
CHED. “Impact on Higher Education.” http://www.ched.gov.ph/index.php/ched-k12-transition-program/the-k12-transition-in-higher-education/.
Unesco IBE (2011). World Data on Education: Philippines, 7th edition, 2010/2011. http://www.ibe.unesco.org/fileadmin/user_upload/Publications/WDE/2010/pdf-versions/Philippines.pdf.
6. OECD (2014). Education at a Glance 2014: OECD Indicators, OECD Publishing. http://dx.doi.org/10.1787/eag-2014-en. Table C2.1 Enrolment rates in early childhood and primary education, by age (2005, 2012). http://dx.doi.org/10.1787/888933118333.
7. OECD (2014). Education at a Glance 2014: OECD Indicators, OECD Publishing. http://dx.doi.org/10.1787/eag-2014-en. Table B4.1. Total public expenditure on education (2011). http://dx.doi.org/10.1787/888933117573.
8. OECD (2014). Education at a Glance 2014: OECD Indicators, OECD Publishing. http://dx.doi.org/10.1787/eag-2014-en. Table D2.1. Average class size, by type of institution and level of education (2012). http://dx.doi.org/10.1787/888933119682.
9. OECD (2014). Education at a Glance 2014: OECD Indicators, OECD Publishing. http://dx.doi.org/10.1787/eag-2014-en. Table D2.2. Ratio of students to teaching staff in educational institutions (2012). http://dx.doi.org/10.1787/888933119682.
10. OECD (2013). PISA 2012 RESULTS IN FOCUS. Snapshot of performance in mathematics, reading and science. http://www.oecd.org/pisa/keyfindings/pisa-2012-results-snapshot-volume-I-ENG.pdf.
Martin, M.O., Mullis, I.V.S., Foy, P., & Arora, A. (2012). The TIMSS 2011 International Results in Mathematics. Chestnut Hill, MA: TIMSS & PIRLS International Study Center, Boston College. http://timssandpirls.bc.edu/timss2011/downloads/T11_IR_M_Chapter1.pdf, p.40.
Martin, M.O., Mullis, I.V.S., Foy, P., & Stanco, G.M. (2012). The TIMSS 2011 International Results in Science. Chestnut Hill, MA: TIMSS & PIRLS International Study Center, Boston College. http://timss.bc.edu/timss2011/downloads/T11_IR_S_Chapter1.pdf, p.38.