

新西兰
1.首都:惠灵顿
2.人口:459.6万人(2015)
3.官方语言:英语、毛利语、新西兰手语
4.货币:新西兰元(NZD)
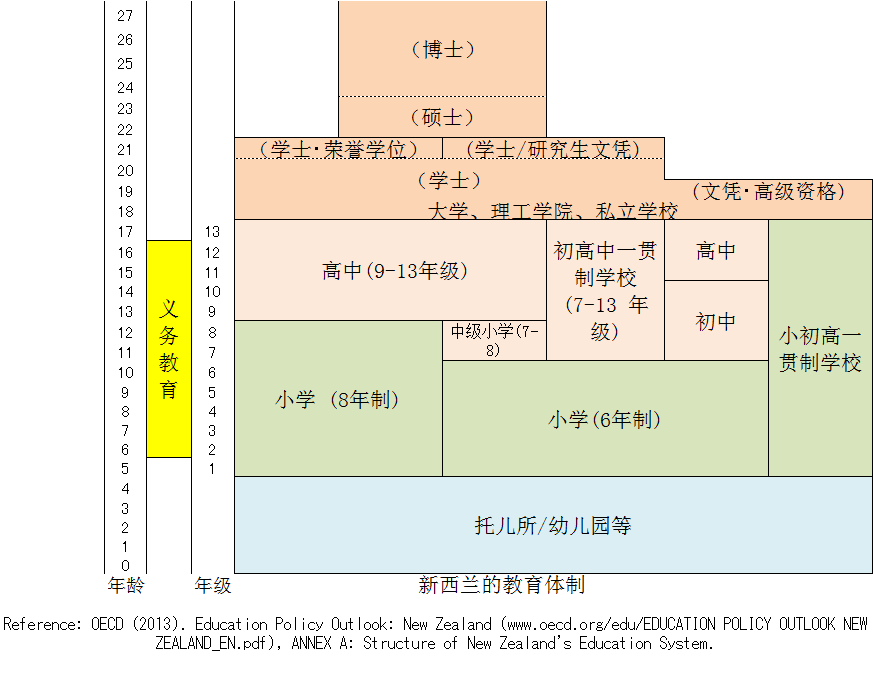
5.教育及保育制度
- 学制:托儿所(0岁至5岁)/幼儿园(3岁至5岁)、小学/中学(5岁至12岁、11岁至12岁为中学)、高中(13岁至17岁)、大学等(18岁起)
- 管辖机构:教育部
- 义务教育:6岁至16岁
- 学前教育有两种形式:教师主导型(幼儿园,教育及保育服务,家庭式教育及保育服务)和家长主导型(毛利父母主导,游戏中心和游戏小组)。
6.入学率
- 3岁:87% (2012)
- 4岁:94% (2012)
- 5岁:99% (2012)
- 6岁:100% (2012)
7.公共财政教育支出占GDP比
- 学前:0.5% (2011)
- 初等・中等・高等教育以外的中等后教育:5.0% (2011)
- 所有教育阶段:7.4% (2011)
8.班级规模(人数)
- 初等教育:暂无数据
9.师生比例
- 学前:7(2012)
- 初等教育:16(2012)
10.国际评价项目中排名
- PISA 2012: 数学-22、阅读-13、科学-18
- TIMSS 2011(4年级):
数学-31、科学-31


相关内容出处
2. Population Division, United Nations. World Population Prospects: The 2012 Revision. http://esa.un.org/unpd/wpp/unpp/panel_population.htm.
5. OECD (2013). EDUCATION POLICY OUTLOOK: NEW ZEALAND (www.oecd.org/edu/EDUCATION POLICY OUTLOOK NEW ZEALAND_EN.pdf), ANNEX A: STRUCTURE OF NEW ZEALAND’S EDUCATION SYSTEM.
Ministry of Education. Choices in early childhood education. http://www.minedu.govt.nz/Parents/EarlyYears/OtherInformationAndResources/Choices/
WhatAreMyChoices.aspx.
6. OECD (2014). Education at a Glance 2014: OECD Indicators, OECD Publishing. http://dx.doi.org/10.1787/eag-2014-en. Table C2.1 Enrolment rates in early childhood and primary education, by age (2005, 2012). http://dx.doi.org/10.1787/888933118333.
7. OECD (2014). Education at a Glance 2014: OECD Indicators, OECD Publishing. http://dx.doi.org/10.1787/eag-2014-en. Table B4.1. Total public expenditure on education (2011). http://dx.doi.org/10.1787/888933117573.
8. OECD (2014). Education at a Glance 2014: OECD Indicators, OECD Publishing. http://dx.doi.org/10.1787/eag-2014-en. Table D2.1. Average class size, by type of institution and level of education (2012). http://dx.doi.org/10.1787/888933119682.
9. OECD (2014). Education at a Glance 2014: OECD Indicators, OECD Publishing. http://dx.doi.org/10.1787/eag-2014-en. Table D2.2. Ratio of students to teaching staff in educational institutions (2012). http://dx.doi.org/10.1787/888933119682.
10. OECD (2013). PISA 2012 RESULTS IN FOCUS. Snapshot of performance in mathematics, reading and science. http://www.oecd.org/pisa/keyfindings/pisa-2012-results-snapshot-volume-I-ENG.pdf.
Martin, M.O., Mullis, I.V.S., Foy, P., & Arora, A. (2012). The TIMSS 2011 International Results in Mathematics. Chestnut Hill, MA: TIMSS & PIRLS International Study Center, Boston College. http://timssandpirls.bc.edu/timss2011/downloads/T11_IR_M_Chapter1.pdf, p.40.
Martin, M.O., Mullis, I.V.S., Foy, P., & Stanco, G.M. (2012). The TIMSS 2011 International Results in Science. Chestnut Hill, MA: TIMSS & PIRLS International Study Center, Boston College. http://timss.bc.edu/timss2011/downloads/T11_IR_S_Chapter1.pdf, p.38.