

韩国
1.首都:首尔
2.人口:4975万人(2015)
3.官方语言:韩语
4.货币:韩元(KRW)
5.教育及保育制度
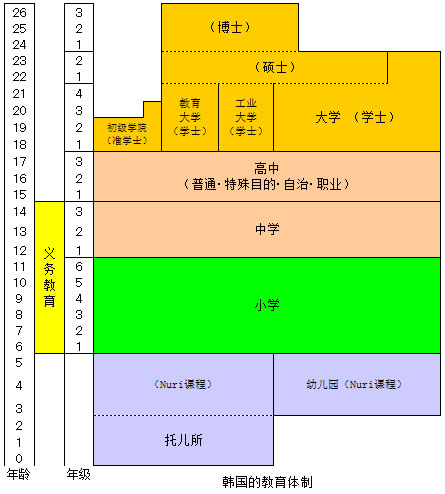
- 学制:托儿所(0岁至5岁)、幼儿园(3岁至5岁)、小学(6岁至11岁)、中学(12岁至14岁)、高中(15岁至17岁)、高等教育(18岁起)
- 管辖机构:教育部(管辖幼儿园、初等教育至高等教育)、卫生福利部(管辖保育机构)
- 义务教育:6岁至14岁
- 近年,韩国政府开始推进幼儿保教一体化,面向所有的3至5岁儿童实施"Nuri"项目。
6.入学率
- 3岁:85% (2012)
- 4岁:87% (2012)
- 5岁:88% (2012)
- 6岁:95% (2012)
7.公共财政教育支出占GDP比
- 学前:0.2% (2011)
- 初等・中等・高等教育以外的中等后教育:3.4% (2011)
- 所有教育阶段:5.0% (2011)
8.班级规模(人数)
- 初等教育:25(2012)
9.师生比例
- 学前:16(2012)
- 初等教育:18(2012)
10.国际评价项目中排名
- PISA 2012: 数学-5、阅读-5、科学-7
- TIMSS 2011(4年级): 数学-2、科学-1


相关内容出处
2. Population Division, United Nations. World Population Prospects: The 2012 Revision. http://esa.un.org/unpd/wpp/unpp/panel_population.htm.
5. OECD (2012). Quality Matters in Early Childhood Education and Care: Korea 2012. http://dx.doi.org/10.1787/9789264175648-en.
OECD. Diagram of Education system. http://gpseducation.oecd.org/CountryProfile?primaryCountry=KOR&treshold=10&topic=EO
6. OECD (2014). Education at a Glance 2014: OECD Indicators, OECD Publishing. http://dx.doi.org/10.1787/eag-2014-en. Table C2.1 Enrolment rates in early childhood and primary education, by age (2005, 2012). http://dx.doi.org/10.1787/888933118333.
7. OECD (2014). Education at a Glance 2014: OECD Indicators, OECD Publishing. http://dx.doi.org/10.1787/eag-2014-en. Table B4.1. Total public expenditure on education (2011). http://dx.doi.org/10.1787/888933117573.
8. OECD (2014). Education at a Glance 2014: OECD Indicators, OECD Publishing. http://dx.doi.org/10.1787/eag-2014-en. Table D2.1. Average class size, by type of institution and level of education (2012). http://dx.doi.org/10.1787/888933119682.
9. OECD (2014). Education at a Glance 2014: OECD Indicators, OECD Publishing. http://dx.doi.org/10.1787/eag-2014-en. Table D2.2. Ratio of students to teaching staff in educational institutions (2012). http://dx.doi.org/10.1787/888933119682.
10. OECD (2013). PISA 2012 RESULTS IN FOCUS. Snapshot of performance in mathematics, reading and science. http://www.oecd.org/pisa/keyfindings/pisa-2012-results-snapshot-volume-I-ENG.pdf.
Martin, M.O., Mullis, I.V.S., Foy, P., & Arora, A. (2012). The TIMSS 2011 International Results in Mathematics. Chestnut Hill, MA: TIMSS & PIRLS International Study Center, Boston College. http://timssandpirls.bc.edu/timss2011/downloads/T11_IR_M_Chapter1.pdf, p.40.
Martin, M.O., Mullis, I.V.S., Foy, P., & Stanco, G.M. (2012). The TIMSS 2011 International Results in Science. Chestnut Hill, MA: TIMSS & PIRLS International Study Center, Boston College. http://timss.bc.edu/timss2011/downloads/T11_IR_S_Chapter1.pdf, p.38.